
Radioactive decay
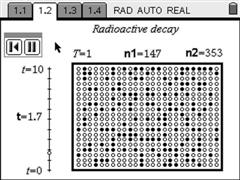
In this animation a group of 500 atoms, marked as black circles, is displayed. When the animation runs some atoms will be replaces by a new type of atoms, marked as white circles. The number of atoms that change at any given time is calculated randomly, according to the expected decay rate from the half life period (adjustable).
Each simulation will give slightly different results, but its properties will be observed in all simulations. A plot of the abundance of the first species vs. time is displayed and an exponential curve can be adjusted to the data.
The goal is to deduct the relationship between the exponential curve and the half time period.
Performance warning: due to the complexity of the calculations the animation is rather slow on TI-Nspire handhelds. However, this loss of performance doesn't constitute an obstacle and actually allows us to keep up with what's happening. On the computer software results are displayed much faster making it harder to see the evolution of the animation.
Download the Radioactive Decay Simulator in: